PIV Image Evaluation
As opposed to the auto-correlation technique the best accuracy is obtained from
cross-correlation which is described here. For auto-correlation only one image
is used and it is exposed twice. The image does not contain any information
about timing so it is unknown which particle image is caused by the first and
which by the second laser pulse.
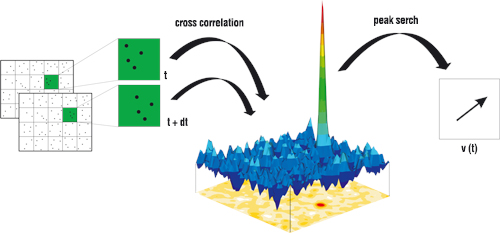
Cross-correlation applied to two frames gives exact information about the direction of a particle's movement because it is known which frame was taken first and which one second.
The full advantage of this method can be appreciated when the higher signal/noise-ratio is considered. Under common conditions the accuracy can be expected to be around 0.1 pixel. With the known pixel size and magnification (lens and distance) this can easily be converted to a real scale in an experiment.

In both frames the images are divided into small areas for which one vector will be calculated.
Processing
Corresponding areas from both frames are searched for identical particles to calculate the displacements.
Correlation
The actual processing is done by FFT giving several peaks where the peak height is a measure of the probability for that particular displacement value.
Vector Display
Subpixel calculations extract the velocity from the correlation and a vector for this interrogation window is obtained.
Post Processing
Additional rules and checks can be applied when the whole field is calculated so that vectors calculated from noise can be discarded.
Display
A variety of display possibilities allow to set a meaningful visual representation of raw data, calculated data and derived data.
